

Ferndock Fitness
FitnessTech · Training & Recovery
Training, recovery and real life. One clearer picture.
I built Ferndock Fitness to bring my running, recovery and daily plans into one place. Its Coach Ferndock assistant uses that context to help me explore the patterns, ask better questions and make room for the life around a training plan.
In development
What was missing from the apps you already used?

The life behind the numbers
Each app already had a place in my routine. Garmin’s feedback could feel stringent, Runna’s AI feedback felt mostly positive, and Strava was more of a social space for me. What I wanted was an honest coach that could look across my stats and trends, then consider the life around them. A difficult run means something different after poor sleep, a stressful week or a packed day.
How does Fitness bring the whole picture together?
From separate apps to a connected view
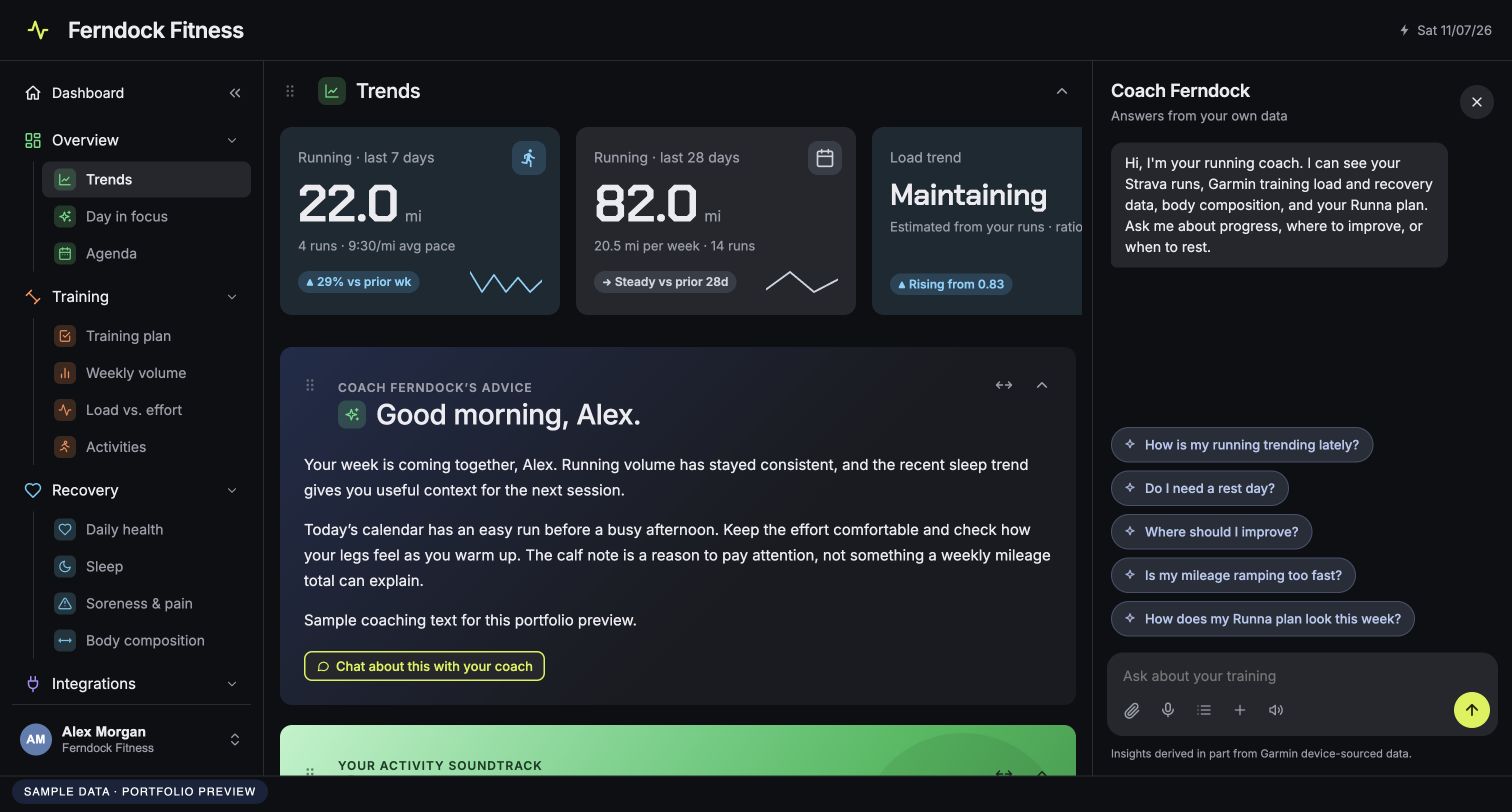
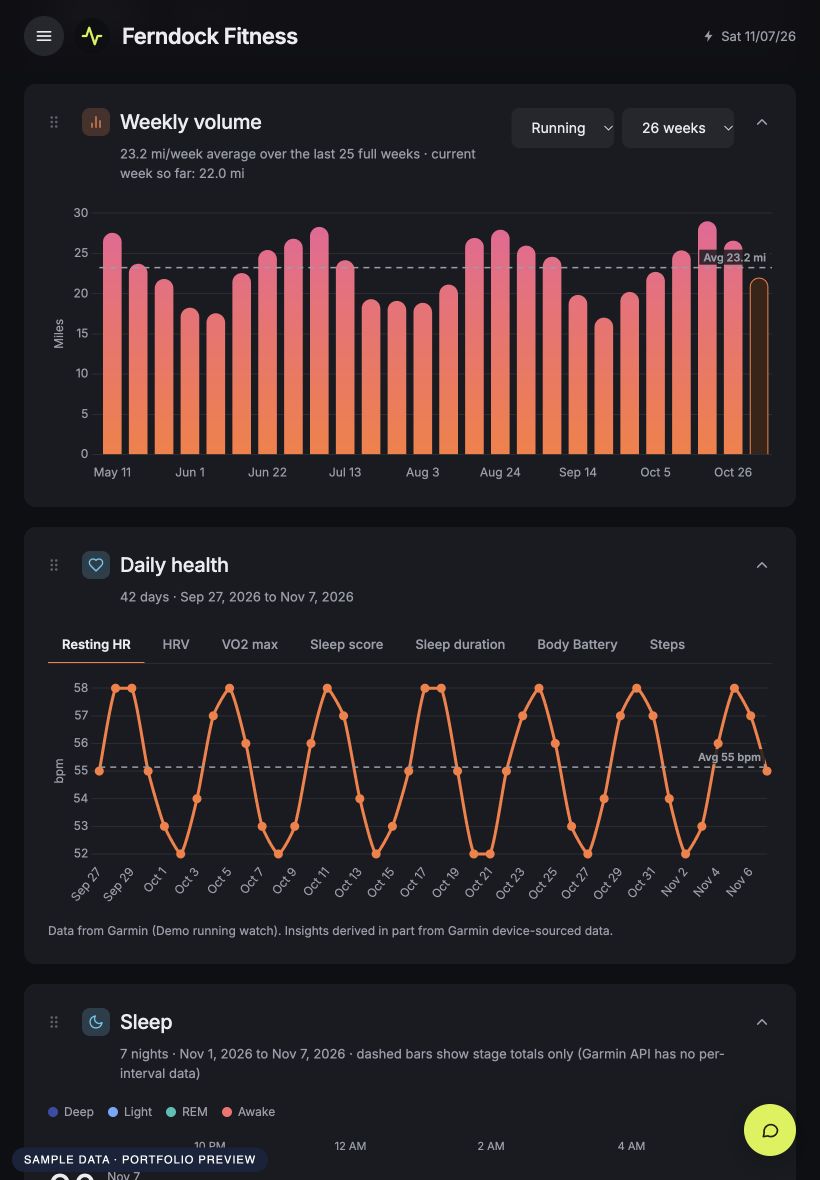
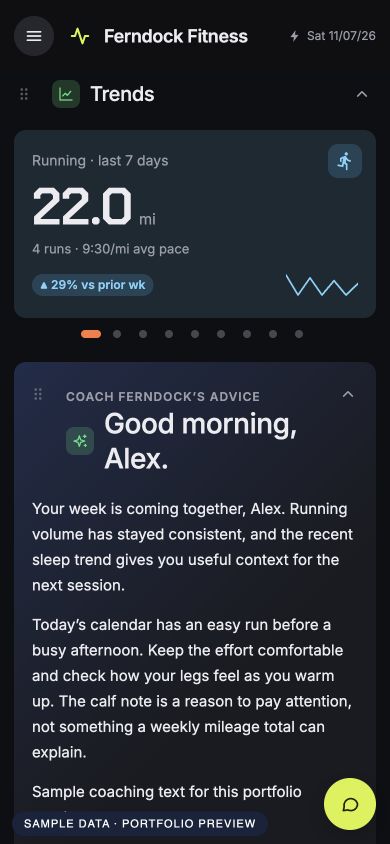
I brought activity history, weekly volume, sleep, recovery and body composition into a responsive dashboard. Trends provide a quick starting point, while charts and activity details let me look closer. Sections can be rearranged, resized and collapsed to suit the way I use the app.
Coach Ferndock sits beside that dashboard. A daily summary connects the information, and follow-up conversations can draw on training history, saved goals, recovery and calendar context. I wanted a coach that explains its reasoning and recognizes missing information, with room to discuss stress, a busy week or how a run actually felt.
The schedule and body-area log add context that a mileage total cannot capture. Runna plans and selected Google calendars help put training alongside everyday commitments. Soreness and pain entries record an area, severity, date and notes; RENPHO screenshot imports add validated measurements for comparison over time.
Bring the sources together
Activity, recovery, training plans and calendar context share one dashboard, while the tools behind them keep their own roles.
Make trends easier to read
Weekly volume, daily metrics and sleep views make changes visible. Filters and expandable sections support a closer look.
Keep the conversation in context
Coach Ferndock connects the data with saved goals and the details you add, so a follow-up question can build on what came before.
Technical details
- Node.js and JavaScript with SQLite storage; Chart.js powers the dashboard charts. The interface includes responsive navigation and a coaching panel.
- The Anthropic SDK powers coaching and daily summaries using selected context sent to the model; the coaching service is not entirely local.
- Strava OAuth and activity sync, Garmin data imports, Runna calendar feeds and selected Google calendars provide context. Garmin refresh supports a configured Personal API integration or a Claude Code connector bridge.
- RENPHO measurements are imported from screenshots and validated before saving. Soreness and pain logs, saved goals and conversations provide ongoing context.
- Charts, tables and infographics can be exported as PNG images. The embedded Activart tools add customizable activity artwork; optional Spotify and weather connections add further context.
- Portfolio captures use the app’s frontend with an isolated fictional data service. Sample records and coaching copy illustrate the interface; they are not personal health records or measured outcomes.
What does that change in your day-to-day routine?
A better starting point for the next decision
Ferndock Fitness gives me one place to connect the dots between what I did, how I recovered and what comes next. I can move from a trend to a question, keep useful context for the next conversation, and export a visual when I want to discuss a pattern with someone else. The value is a more informed conversation, rather than a promise that a score or an AI answer tells the whole story.
Record how it actually feels
A visual body-area log keeps soreness and pain entries together with dates, severity and notes.
Take useful visuals with you
Export charts, tables and infographics to support a conversation about a trend, including with a health professional.
Make the dashboard your own
Reorder and collapse sections, adjust their widths, and use the responsive layout on desktop, tablet or phone.
Where can I use it?
A personal app, still evolving
Ferndock Fitness is running locally as an evolving personal application. The dashboard adapts to desktop, tablet and phone, with Coach Ferndock available alongside the data. These screenshots use fictional sample records and sample coaching copy to demonstrate the interface without exposing personal health information. There is no public app link.
Want to talk about the work?
Connect on LinkedIn